
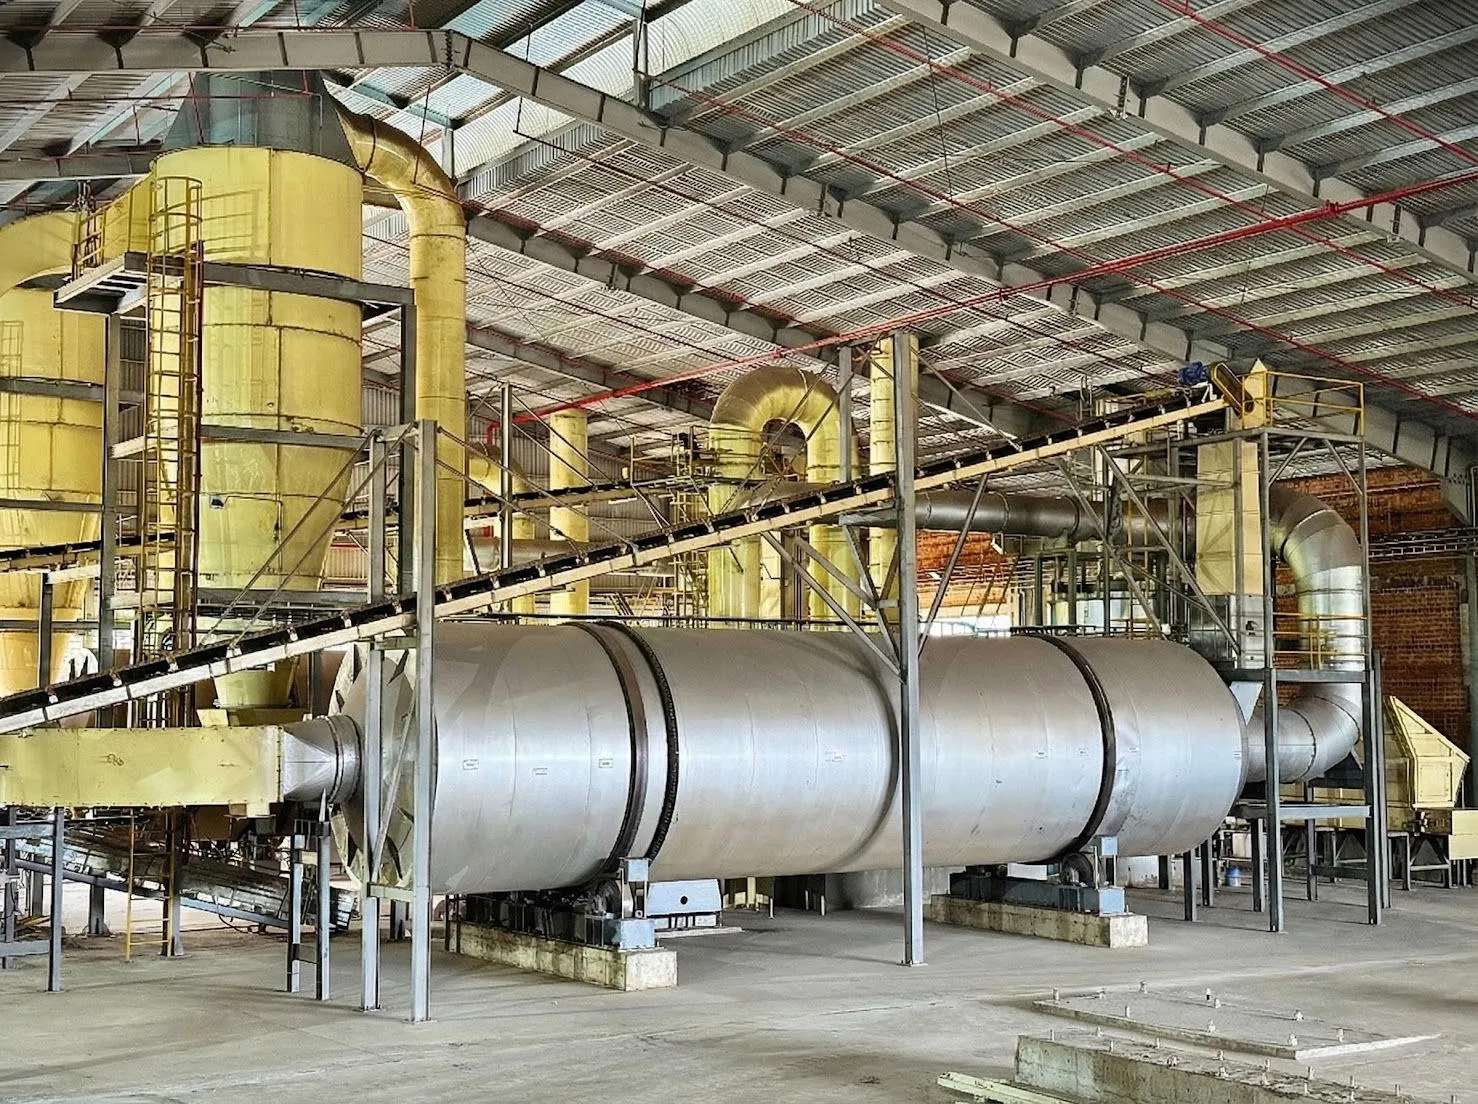
Process control, energy and maintenance
Manufacturing
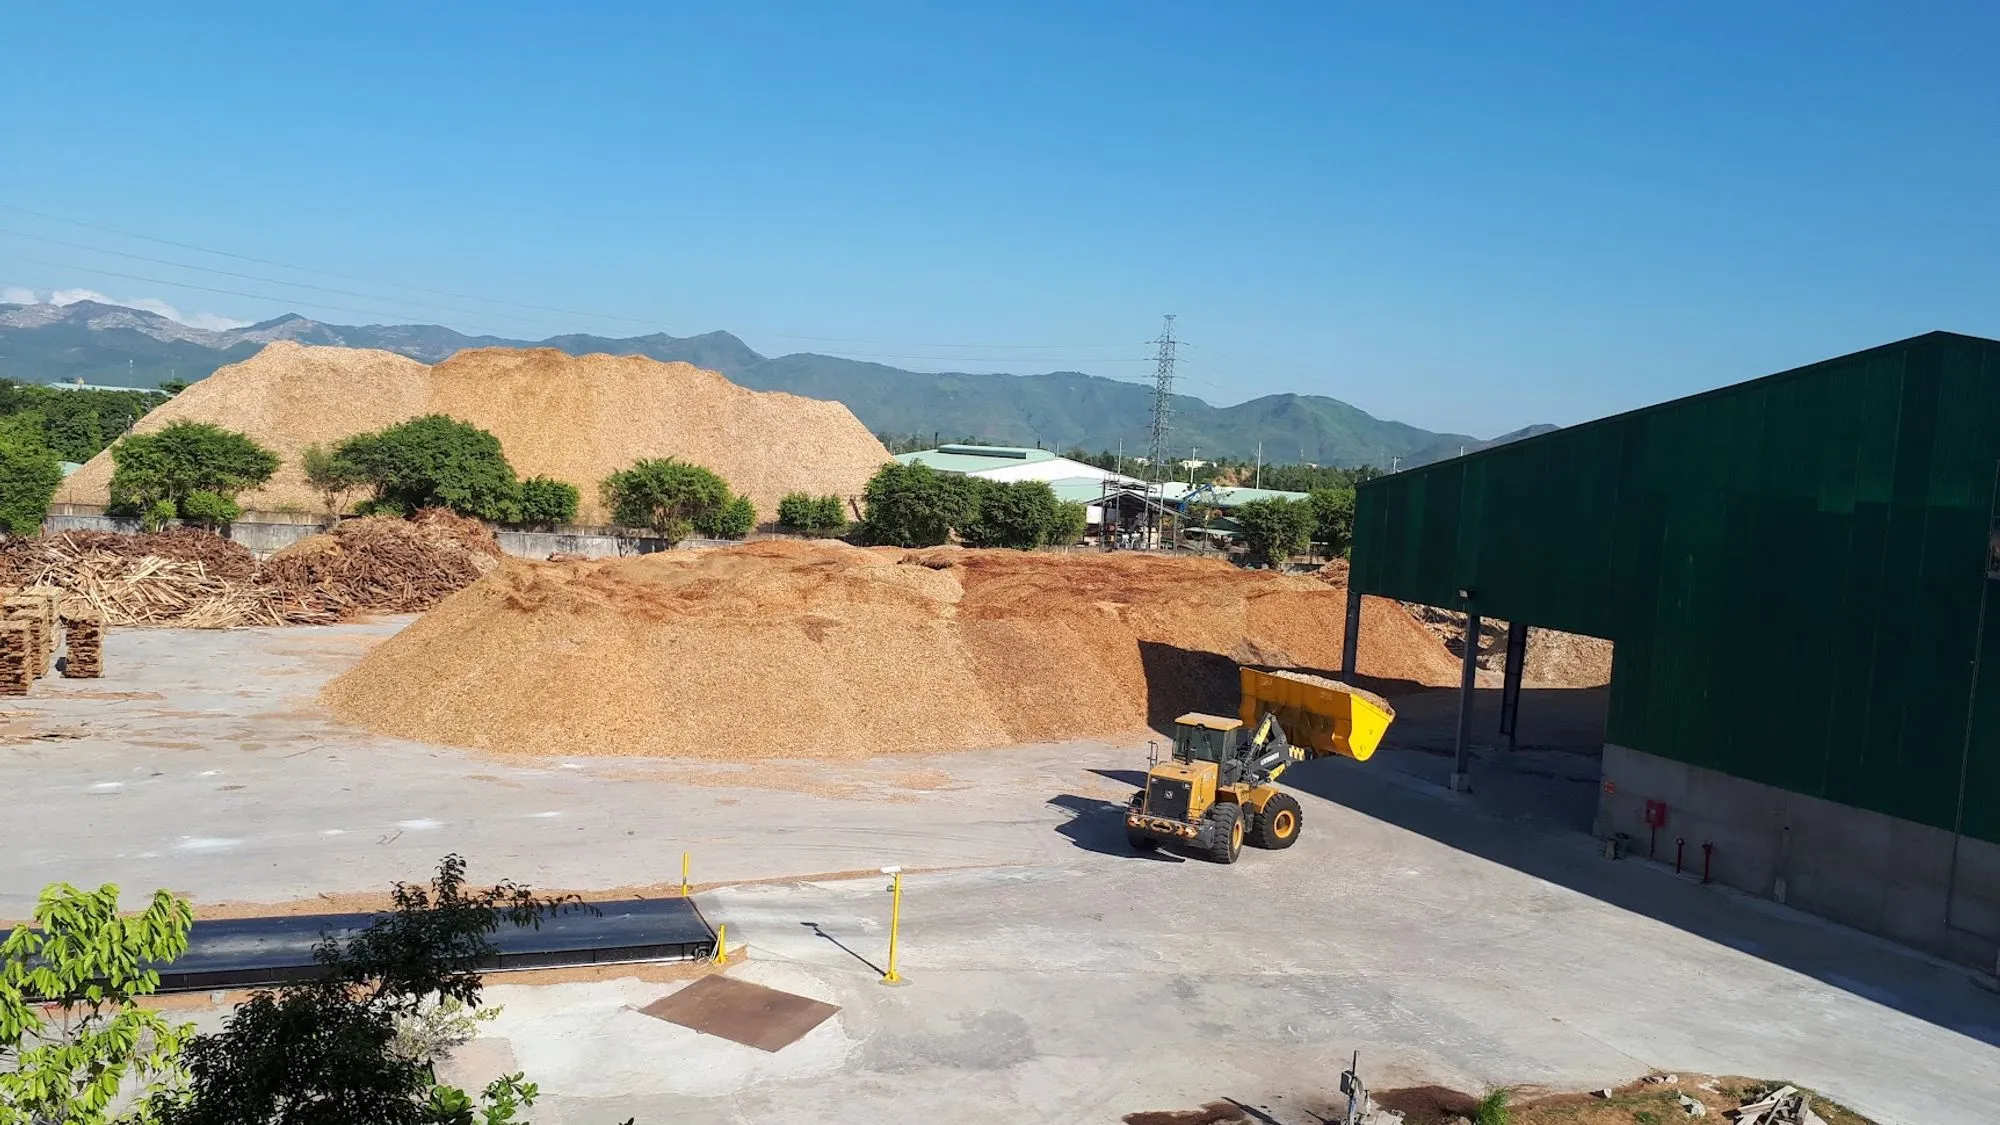
Raw materials and operating conditions vary from load to load. Moisture, particle size, composition and temperature can change with the supplier, season and batch, and every machine downstream has to absorb that variation. When the process begins to drift or equipment starts to degrade, the warning often appears first as a gradual trend rather than an alarm. If those trends are not recorded, connected and reviewed in context, problems may only become obvious after energy use rises, product quality shifts or equipment trips.
What goes wrong, and what it costs
- Variable inputs move the process away from its target
- Changes in moisture, particle size, composition or temperature alter the amount of thermal and mechanical work required. If the process does not adapt, energy use, throughput or product quality can drift.
- Blend or recipe changes propagate through the line
- A change in material mix can increase the load on one machine and change the conditions seen by the next. Without batch context, the cause may be difficult to trace after performance begins to move.
- Condensation develops in the gas path
- When gas temperature approaches the dew point, moisture can condense and cause dust or material buildup on downstream equipment. Over time, that buildup can affect airflow, balance, and equipment reliability.
- Equipment condition degrades gradually
- Vibration, current or temperature may worsen over days or weeks while individual readings remain below alarm limits. Looking at the trend together with maintenance history can reveal degradation earlier.
- A sensor stops responding without reporting a fault
- A frozen or drifting sensor can continue reporting a plausible value while no longer representing the process accurately. Detecting abnormal sensor behavior is therefore part of maintaining reliable process data.
Proof
Ayo Biomass runs on Koidra across multiple sites, and its dryers gained 20% in operational efficiency after a two-phase KoPilot deployment. The failure modes on this page are the ones their engineers actually write root cause analyzes about, generalized to the sector and stripped of anything specific to one product line.
What process plants have in common
Manufacturing processes differ widely, but several operational challenges appear again and again.
- Inputs vary, and the process has to absorb that variation
- Moisture, composition, particle size and temperature can change between suppliers, seasons and production batches. A control strategy that assumes constant input conditions will not always produce consistent results.
- Efficiency can drift without triggering an alarm
- Nothing has to fail for energy per tonne to increase. A gradual change in operating conditions can raise energy use for days or weeks before it becomes obvious in production reports or utility costs.
- Equipment condition changes gradually
- Vibration, temperature, current and other signals can begin moving long before a machine trips. Looking at those trends together with maintenance history makes gradual degradation easier to identify.
Where we go deepest
Koidra is particularly suited to energy-intensive process equipment such as dryers, mills, boilers, kilns, furnaces and the thermal utilities around them.
These systems share a common control problem: variable material enters the process, equipment converts it toward a target specification, and operators must continuously balance throughput, quality, energy use and equipment limits.
Works with the control system you have
Koidra connects to the PLC and SCADA systems already running your plant and reads the data they already hold. That data, with the notes your operators add beside it, goes in front of the people who decide, so a decision that used to wait for the weekly report is made on what the plant is doing now.
When you are ready for KoPilot, the same connection carries setpoints back to the SCADA, autonomously, inside the limits your engineers set. Everything before that runs on read-only access.
Which systems and protocols we read and write is on the integrations page.
Failures develop before they become events
Not a sudden event. A shape that repeats for weeks while every individual alarm looks survivable.
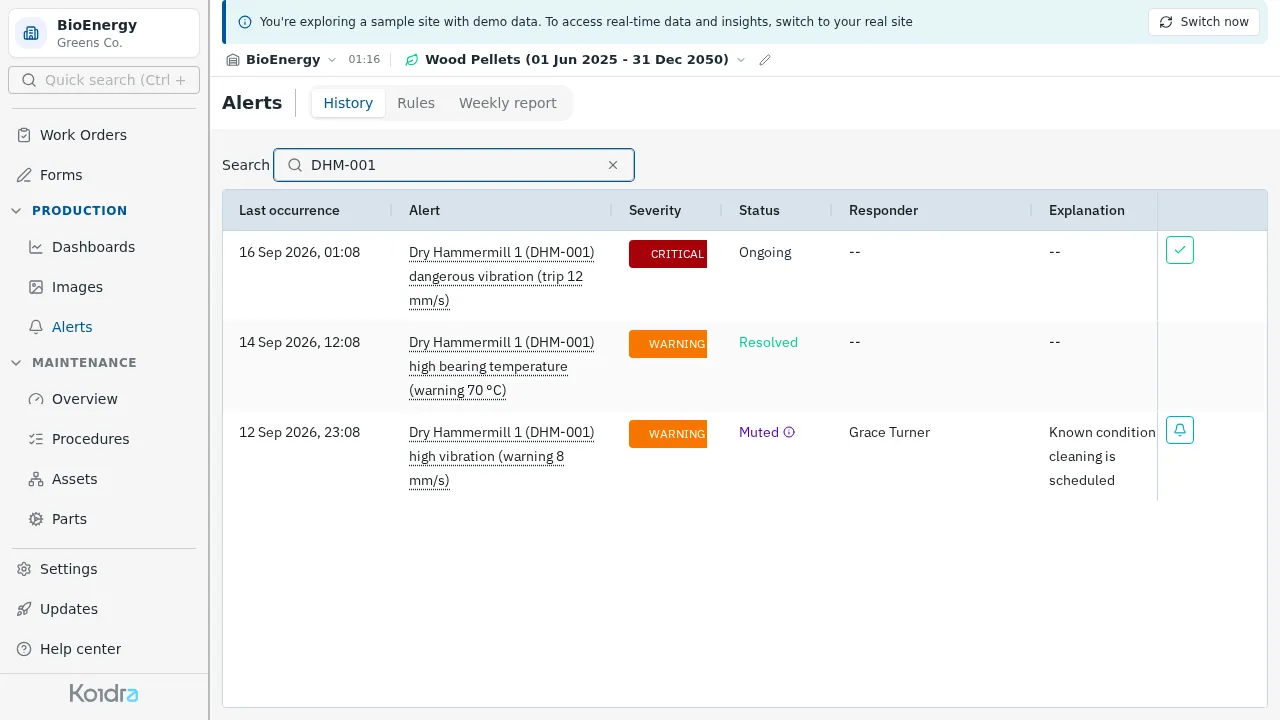
Vibration may increase over several days, fall after cleaning or maintenance, and then begin rising again. Each individual alarm may appear manageable, but the repeated pattern can indicate a developing reliability problem.
Seeing that pattern requires more than an isolated alert. It requires enough historical data to show the trend and maintenance records on the same timeline to show what happened between one event and the next. That is the value of bringing process and maintenance data into one operational record.
What each product gives a plant like yours
Two ways in, a layer that needs both, and control on top. Each is a complete product with its own payback. Here is what they do here rather than in general.
-
Start here
DataPilot
Mill current, dryer outlet temperature and energy per tonne on one clock, with the moisture readings your shift team types in beside them. A dew point margin nobody was comparing becomes a number you can set an alarm on.
-
Start here
Maintenance Management
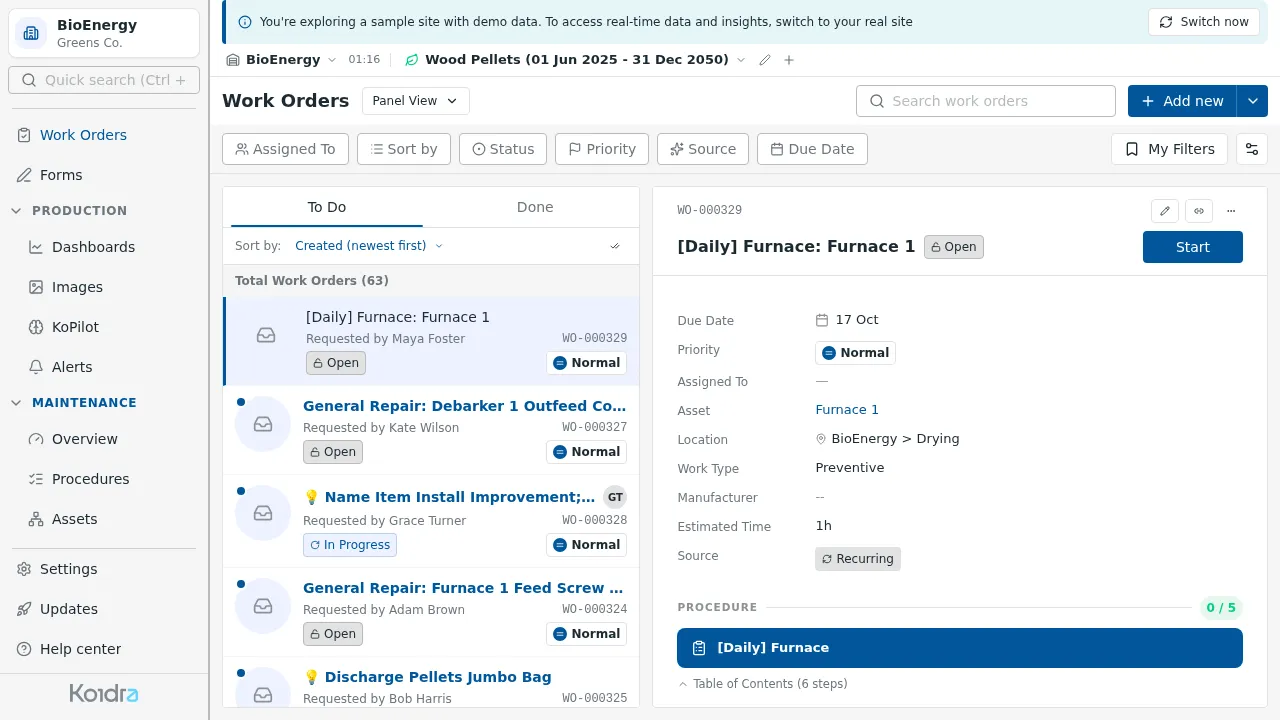
Vibration climbing over weeks opens a work order against the fan itself, with its own history attached, instead of four alerts each closed as a separate event. Preventive work is scheduled on running hours and tonnes, not a calendar.
-
Comes with both
AI Advisory
A weekly account of where energy per tonne went, by line and by product, and the follow-up answered from the same record: which supplier, which batch, which shift, and whether a setpoint moved. And what to change to bring it down.
Two reports run on a timer, a recommendation says what to change against the KPIs you set, and a work order opens when a trend says a failure is coming. Your KPIs and your questions go in, and what comes back is drawn from the same record everything else was built from. -
Autonomous control
KoPilot
Combustion air ratio and dryer setpoints moved against the moisture actually arriving, inside an envelope your process engineers set, so the line absorbs input variation rather than tripping on it.
The envelope is a separate box on purpose. It states what the loop may not do, and it is engineered for the site rather than learned from it, which is why a model that has never seen your plant is still safe to run on it.
What we measure here
- energy per tonne
- process drift
- production batch
- dryer outlet temperature
- dew point margin
- mill current
- combustion air ratio
- preventive maintenance completion
- sensor health
See Koidra on your plant data
Bring a week of readings from one line. We will show you what the platform sees, what it would have flagged, and what it would have scheduled.
Book a demo