
Maintenance, energy and production
Manufacturing
Every shift runs like your best one.
Your best shift already proves what the plant can do. Koidra makes it the standard.
Where the gains come from
- 55 to 60%
- average equipment effectiveness in plants worldwide Evocon, 2024. Vendor data from 3,500 machines in 50 countries.
- 51%
- of the energy a plant uses on site goes to process heat US Department of Energy, 2018 data
- 2.8 million
- US manufacturing jobs to refill as workers retire, by 2033 Deloitte and The Manufacturing Institute, 2024
- Fewer unplanned stops
- Plants that plan their maintenance lose far less time than plants that fight fires. Schedules, work orders and early warnings move the work onto the calendar.
- More product from the same line
- Slow running and short stops cost more output than breakdowns do. Seeing where the hours go finds tonnes before you spend on new equipment.
- Less energy in every tonne
- Most of a plant's energy becomes heat, and different crews spend it differently on the same line. Holding every shift to your best one's settings puts the difference back in your margin.
- What your best people know, kept
- Experienced operators and technicians are retiring. When every repair, reading and fix is on record, the next person runs the line the way they did.
What process plants have in common
Manufacturing processes differ widely, but several operational challenges appear again and again.
- Inputs vary, and the process has to absorb that variation
- Moisture, composition, particle size and temperature can change between suppliers, seasons and production batches. A control strategy that assumes constant input conditions will not always produce consistent results.
- Efficiency can drift without triggering an alarm
- Nothing has to fail for energy per tonne to increase. A gradual change in operating conditions can raise energy use for days or weeks before it becomes obvious in production reports or utility costs.
- Equipment condition changes gradually
- Vibration, temperature, current and other signals can begin moving long before a machine trips. Looking at those trends together with maintenance history makes gradual degradation easier to identify.
Where we go deepest
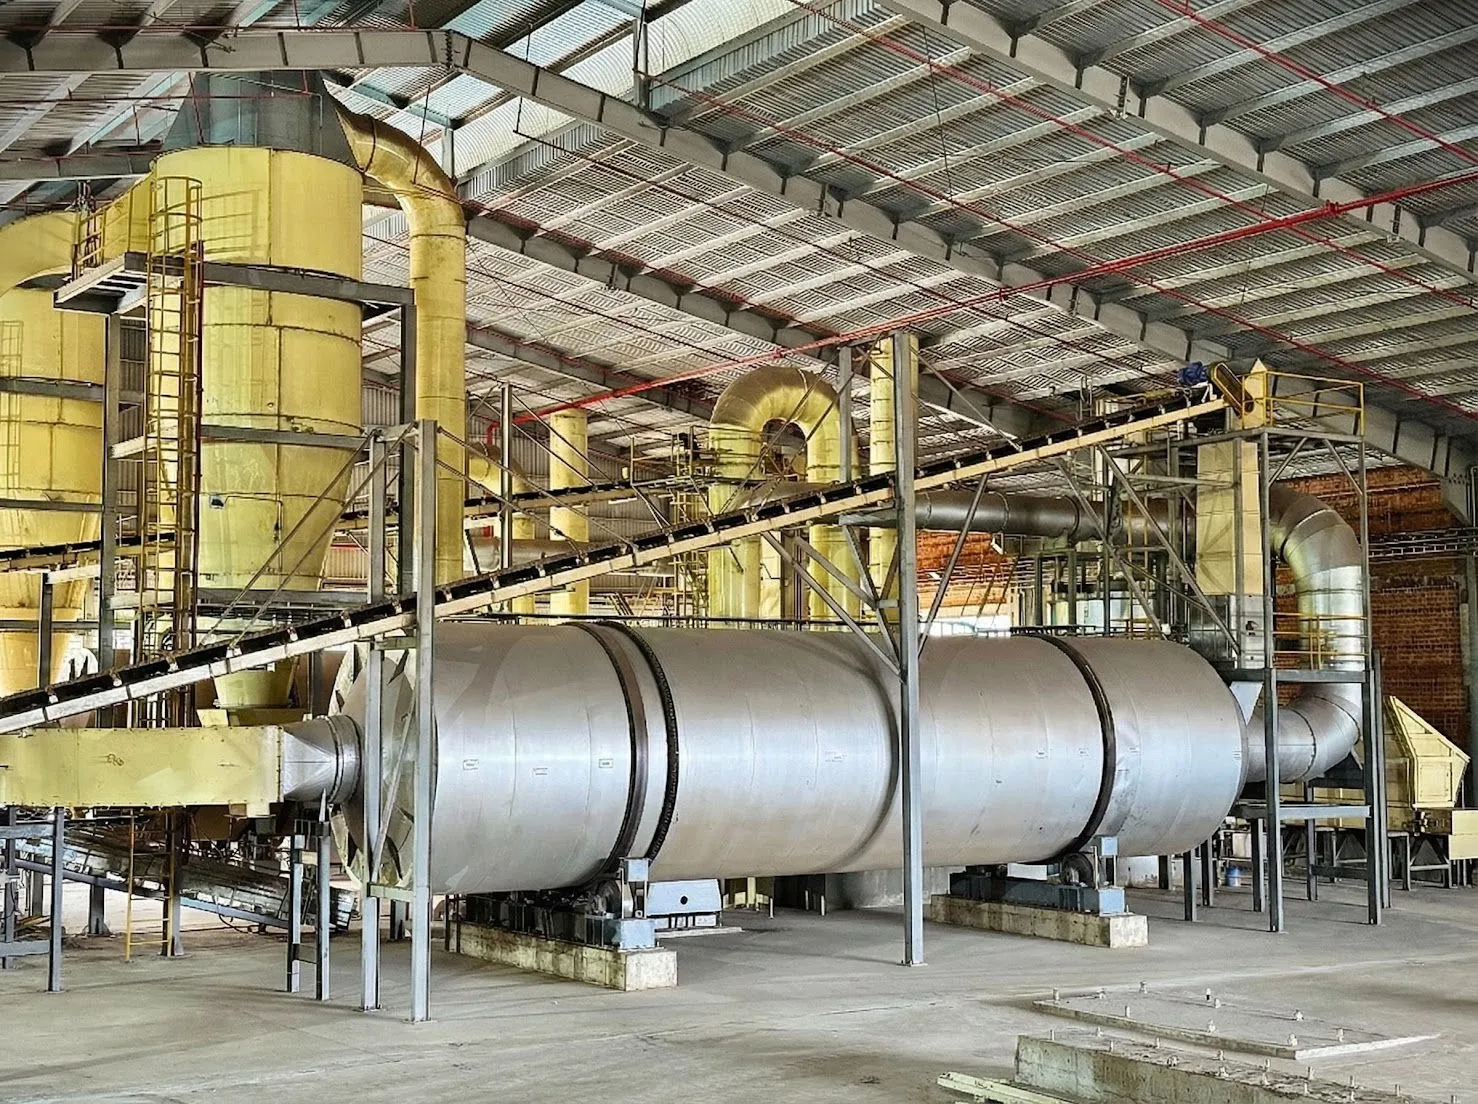
Koidra is particularly suited to energy-intensive process equipment such as dryers, mills, boilers, kilns, furnaces and the thermal utilities around them.
These systems share a common control problem: variable material enters the process, equipment converts it toward a target specification, and operators must continuously balance throughput, quality, energy use and equipment limits.
Works with the control system you have
Koidra connects to the PLC and SCADA systems already running your plant and reads the data they already hold. That data, with the notes your operators add beside it, goes in front of the people who decide, so a decision that used to wait for the weekly report is made on what the plant is doing now.
When you are ready for KoPilot, the same connection carries setpoints back to the SCADA, autonomously, inside the limits your engineers set. Everything before that runs on read-only access.
Which systems and protocols we read and write is on the integrations page.
Failures develop before they become events
Not a sudden event. A shape that repeats for weeks while every individual alarm looks survivable.
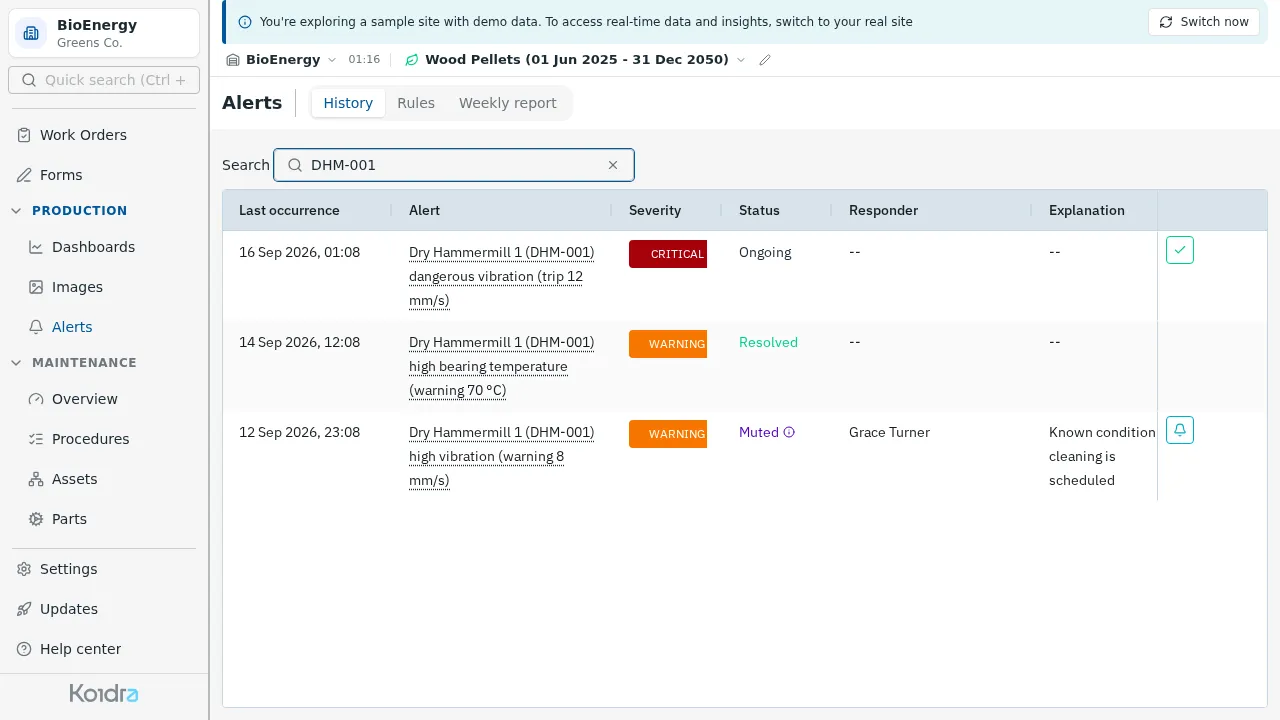
Vibration may increase over several days, fall after cleaning or maintenance, and then begin rising again. Each individual alarm may appear manageable, but the repeated pattern can indicate a developing reliability problem.
Seeing that pattern requires more than an isolated alert. It requires enough historical data to show the trend and maintenance records on the same timeline to show what happened between one event and the next. That is what unified operational data gives you.
Why you can act on what it tells you
Predix runs on models grounded in the physics of your process and on your own operating history, not on a language model alone. So what it reports has already been checked against how the plant behaves.
That is what makes a report precise enough to act on rather than something to verify first.
Earn autonomy one decision at a time
Start read-only. Run recommendations in shadow. Automate only what is repeated, measured and bounded.
- See
- Your plant’s data in one place, checked and trusted, with a baseline for every line.
- Understand
- Drift and its likely causes, explained against the records your team already keeps.
- Recommend
- Changes to settings and to maintenance, each one approved by a person before anything happens.
- Control
- Setpoints written back inside limits your engineers set, with your safety systems and interlocks still in charge.
What each product gives a plant like yours
Start with Koidra CMMS or DataPilot. Predix needs both, and KoPilot adds control on top. Each product pays for itself on its own.
-
Start here
DataPilot
Energy per tonne, temperatures and motor current on one clock, with the readings your shift team types in beside them. A trend nobody was watching becomes a number you can set an alarm on.
-
Start here
CMMS
Vibration climbing over weeks opens a work order against the fan itself, with its own history attached, instead of four alerts each closed as a separate event. Preventive work is scheduled on running hours and tonnes, not a calendar.
-
AI insights
Predix
A weekly account of where energy per tonne went, by line and by product, and the follow-up answered from unified operational data: which supplier, which batch, which shift, and whether a setpoint moved. And what to change to bring it down.
Predix works on the unified operational data from DataPilot and Koidra CMMS, measured against the targets you set. -
Autonomous control
KoPilot
Combustion air ratio and dryer setpoints moved against the moisture actually arriving, inside limits your process engineers set, so the line absorbs input variation rather than tripping on it.
Every new setting passes through limits your engineers set for your site. The AI cannot learn or change them, and your safety systems and interlocks stay in charge.
Proof
- 20%
- higher dryer operational efficiency at Ayo Biomass After a two-phase deployment
- 2×
- winner of the Autonomous Greenhouse Challenge Greenhouse control, a different domain from this page
Ayo Biomass runs on Koidra across multiple sites. The work went in two phases: first the plant’s data in one place, then KoPilot adjusting the dryers against the moisture actually arriving.
The control behind it was proven in greenhouses first, a different domain run by the same heat, mass and airflow, in the Autonomous Greenhouse Challenge, against expert growers on a live crop.
Every deployment starts read-only, on the data your plant already has. Limits are agreed with your engineers before anything writes back, and your safety systems stay in charge.
What we measure here
- energy per tonne
- process drift
- production batch
- dryer outlet temperature
- dew point margin
- mill current
- combustion air ratio
- preventive maintenance completion
- sensor health
See Koidra on your plant data
Bring a week of readings from one line. We will show you what the platform sees, what it would have flagged, and what it would have scheduled.