
Start here
DataPilot
Every signal the plant produces, in one place, live and historical.
Connecting your control system is done with a Koidra engineer rather than a form. Tell us what you run and we will scope it.
How it works
Everything on this page is also reachable over our API, including from the AI tools your team already uses, so Claude or ChatGPT can query the same record directly. We send the reference on request.
What it takes over from
- The control-room panel
- Screenshots sent over messaging apps
- Paper clipboards and shift logbooks
- Spreadsheets nobody maintains
- A standalone historian
Pays for itself by
Replacing the paper log, the messaging-app screenshot, and the week of trend history that used to vanish. Catching a drift before it becomes a trip.
The number a buyer checks: Unplanned downtime avoided, and hours a week not spent assembling reports.
What DataPilot includes
DataPilot is the plant's shared operational record. It brings together data from machines, people and production activities, organized around the same equipment and timeline.
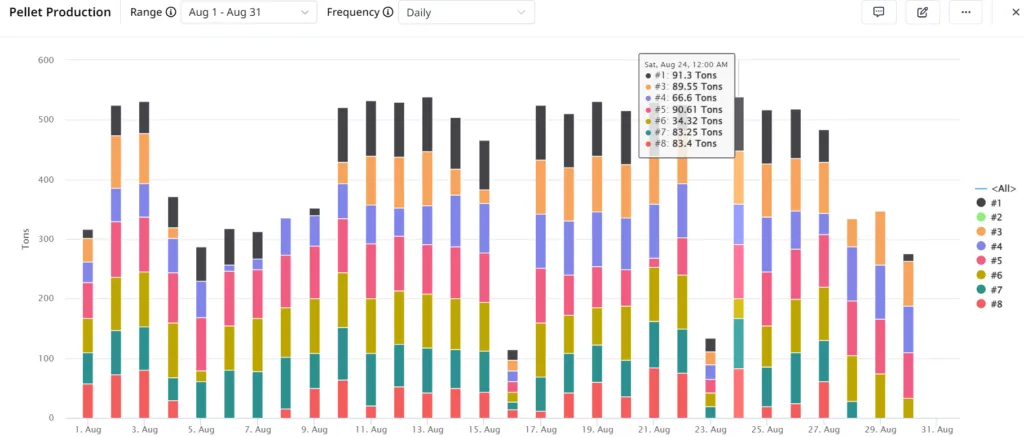
- Process and energy data
- Data from your existing PLCs, sensors, meters and control systems, collected at the frequency they already provide it.
- Operator-entered data
- Shift logs, quality checks, moisture readings, downtime notes and other observations entered directly from a phone or workstation.
- Photographs
- Images of equipment condition, leaks, finished products or other events, attached to the relevant equipment and time.
- Production batches
- Runs, campaigns, crop cycles or other production periods that connect operational data to what was being produced.
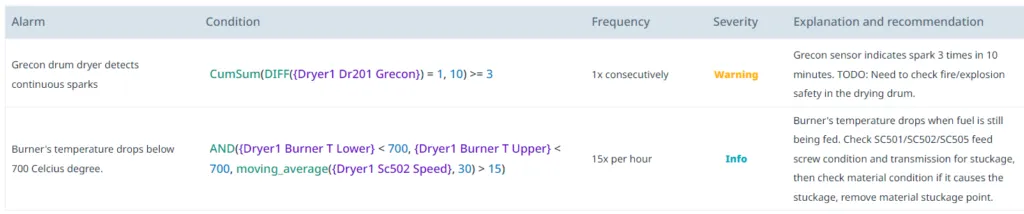
- Alarms and notifications
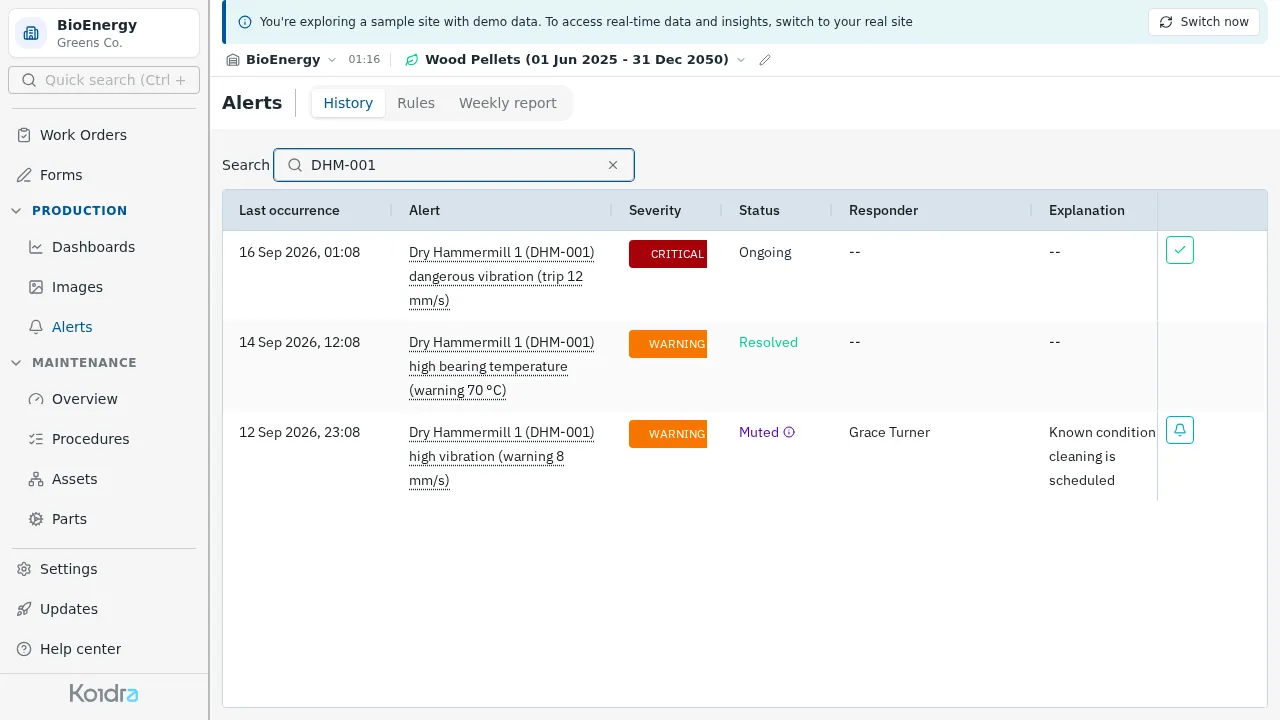
- Rules that notify the right people when a value or condition needs attention.
Why machine data and operator notes belong together
Most plants already collect sensor data. The harder part is connecting it with what operators observe and record during the day. DataPilot keeps both in one operational record, linked to the same equipment and timeline.
- An alarm can fire on a number a person typed
- Not only on a sensor. A moisture reading from the shift log can raise the same alert a meter would.
- A historian sees the machines. A maintenance system sees the assets.
- DataPilot sees both, so it can show what the equipment was doing, what operators observed, and what happened next.
- One of the two things AI Advisory needs
- With Maintenance Management beside it, a developing trend can open a work order, and a weekly report can explain what changed using both sensor data and operator notes. What AI Advisory does with it.
What you can stop doing. Standing at a control panel just to read a value. Sending screenshots of charts through group chats. Maintaining separate spreadsheets because historical data is difficult to access. Asking several people to reconstruct what happened during a previous shift. DataPilot keeps that information in one place, tied to the equipment and time it belongs to.
Getting your data into your own tools
Everything stored in DataPilot can be accessed through our API, including process trends, operator readings, production batches, alarms and maintenance records, all linked to the same equipment and timeline.
That also makes the data available to AI tools your team already uses. Your team could ask ChatGPT or Claude what changed during the night shift, compare operating conditions between production runs, or retrieve maintenance costs by asset without first exporting data to a spreadsheet.
AI answers are only as useful as the information available to them. Giving AI access to a complete operational record makes those answers grounded in what actually happened at the plant. API documentation is available on request.
Where this sits
Two ways into one platform, a layer that needs both, and control on top. Each is a complete product with its own payback. How the pieces fit.
-
Start here
Maintenance Management
The system decides what maintenance is due, dispatches it, and tracks what it cost.
-
Start here
DataPilot
Every signal the plant produces, in one place, live and historical.
-
Comes with both
AI Advisory
Reports on what changed, answers in plain language, what to change to move the KPIs you set, and predictive maintenance: failures seen before they arrive.
-
Autonomous control
KoPilot
Closed-loop control of the process, minute by minute, with no human at the panel.
Add Maintenance Management and AI Advisory becomes available. It needs both, and it comes with both.
See Koidra on your own plant data
Bring a week of readings from one line. We will show you what the platform sees, what it would have flagged, and what it would have scheduled.
Book a demo