
Build your own metrics: VPD, energy per ton and OEE from the signals you already have
A sensor gives you a raw reading. The numbers you manage by are made from several readings at once: a vapor pressure deficit from three sensors, an energy figure per ton from three meters and a belt scale, an OEE from a run signal and two counters. DataPilot’s formula engine lets you write each of those once. From then on it behaves like any other metric: it charts beside the readings it came from, it can raise an alarm, it appears in the weekly report, and it is there over the API.
How a formula works
A formula is one line of arithmetic over the metrics your site already records, written the way you would write it in a spreadsheet. You pick each metric by name, so {Air temperature} rather than a tag number, and combine them with the usual operators and a set of functions: IF, AND, MIN and MAX, MovAvg for a rolling average, CumSum for a running total, daily for a total that restarts at midnight, STDDEV and TREND for how a signal is moving.
A window is counted in samples. At the five-minute resolution most sites run, 12 samples is an hour and 288 is a day. A new formula is computed over your history as well as from now on, so the metric arrives with a past, and a chart of it goes back as far as its inputs do.
A greenhouse example: VPD
Vapor pressure deficit is the gap between how much water the air could hold and how much it holds. It is the number that drives transpiration, and no sensor measures it. It is calculated from temperature and humidity, and DataPilot has it built in:
VPD(leaf_temperature, air_temperature, relative_humidity)The result is in kilopascals. The saturation side uses the leaf temperature, which is the deficit the plant actually experiences; without a leaf sensor, pass the air temperature twice. Written out, it is the Tetens formula for saturation pressure minus the vapor pressure of the air:
saturation_vapor_pressure(leaf_temperature) - vapor_pressure(relative_humidity, air_temperature)Two metrics growers keep beside it, one line each. The first is the 24-hour average temperature. The second is the daily light integral in mol per square meter, from a PAR sensor that reads micromoles per second: 300 seconds per sample, summed over a day.
MovAvg(air_temperature, 288)

CumSum(par_canopy, 288) * 300 / POW(10, 6)
An alarm on a calculated metric is written the same way as the metric. To be told when VPD has stayed below your lower bound for an hour, rather than dipped for a single sample, the rule averages the metric you just saved over 12 samples:
MovAvg(vpd, 12) < 0.5The bound is yours. The point is that the alarm reads a number that no sensor produces.
A manufacturing example: output, energy and energy per ton
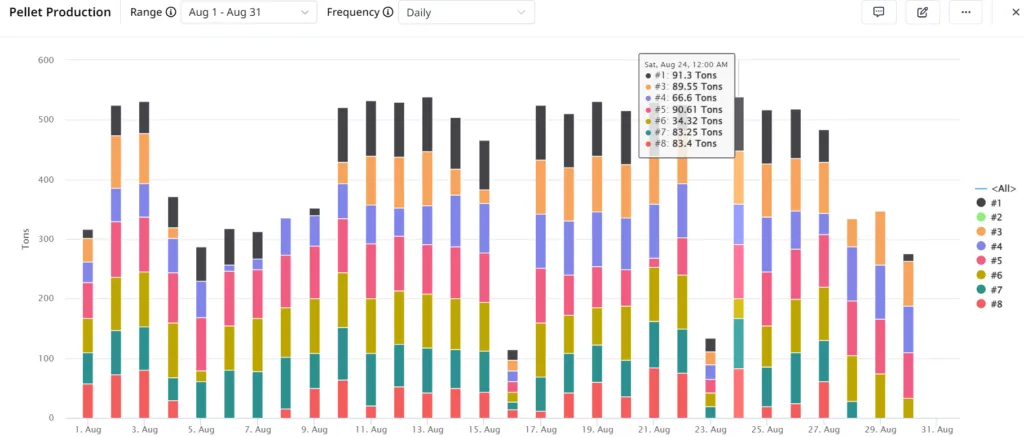
On a pellet line the raw signals are a belt scale at the outfeed, reading tons per sample, and an energy meter on each large consumer: the dryer, the hammer mill and the pellet press. Totals since midnight are one function each:
daily(pellets_out)

daily(dryer_kwh) + daily(mill_kwh) + daily(press_kwh)
Energy per ton so far today divides the two, guarded so that the first minutes of a shift do not divide by zero. Until the first ton is out, it reads zero:
IF(daily(pellets_out) > 0,
   (daily(dryer_kwh) + daily(mill_kwh) + daily(press_kwh)) / daily(pellets_out),
   0)
A day is not the only period worth totaling. CumSum(dryer_kwh, 12) is the last hour’s kilowatt-hours on the dryer. CumSum_From restarts a running total at an event, such as the start of the batch DataPilot is tracking, so the same three lines give you output, energy and energy per ton per batch instead of per day. That is the figure a plant manager compares across suppliers, since the moisture of the wood coming in is what moves it.
OEE from the same signals
Overall equipment effectiveness is availability times performance times quality. Each of the three is a ratio of things the line already records. The run signal press_running comes from the PLC, 1 when the press runs and 0 when it does not. Rejects come from the quality check the operator types into the shift log, and DataPilot treats a typed number exactly like a sensor reading. The planned minutes for the shift and the rated tons per hour of the press are values someone sets rather than reads; DataPilot refers to a set value with an @.
Availability is run time over planned time. Each sample of the run signal is five minutes:
daily(press_running) * 5 / @planned_minutesPerformance is what came out over what the press should have made in the time it ran:
daily(pellets_out) / (daily(press_running) * 5 / 60 * @ideal_rate_tph)Quality is good output over all output:
(daily(pellets_out) - daily(rejects)) / daily(pellets_out)OEE is the product of the three. Save each as its own metric and write the last one over them, with the same zero guard as above on every division:
availability * performance * qualityKeeping the three parts as separate metrics is the useful bit. An OEE that fell because the press stood still for two hours calls for a different conversation than one that fell because a tenth of the output was rejected, and a chart of the three beside each other shows which it was before anyone asks.
What a calculated metric can do
- Chart it beside its inputs. A jump in energy per ton opens into the dryer meter and the belt scale it came from, on the same timeline.
- Alarm on it. Smart Alarms take any metric, including one built from a number an operator typed in.
- Report on it. AI Advisory’s daily and weekly reports are built from the metrics your team tracks, calculated ones included, so energy per ton appears next to production and downtime without anyone assembling it.
- Read it over the API. Everything DataPilot holds is available to your own tools and to the AI assistants your team already uses.
Every site has a handful of numbers like these that today live in a spreadsheet someone fills on Monday. DataPilot is where they stop being assembled by hand. If you would like to see yours calculated from a week of your own readings, book a demo.